RESEARCH ARTICLE
Tuberk Toraks 2019;67(1):1-7
Akut pulmoner emboli hastalarında tedavi ?ncesi ve sonrası
sol atriyum boyutu ve hastalığın şiddeti arasındaki ilişkinin
bilgisayarlı tomografi pulmoner anjiyografi ile değerlendirilmesi
Kerim ASLAN1, Ahmet Veysel POLAT1, Ayg?l G?ZEL2, Mesut ?ZT?RK1
1 Ondokuz Mayıs ?niversitesi Tıp Fak?ltesi, Radyoloji Anabilim Dalı, Samsun, T?rkiye
1 Department of Radiology, Faculty of Medicine, Ondokuz Mayis University Samsun, Turkey
2 Ondokuz Mayıs ?niversitesi Tıp Fak?ltesi, G?ğ?s Hastalıkları Anabilim Dalı, Samsun, T?rkiye
2 Department of Chest Diseases, Faculty of Medicine, Ondokuz Mayis University, Samsun, Turkey
?ZET
Akut pulmoner emboli hastalarında tedavi ?ncesi ve sonrası sol atriyum boyutu ve hastalığın şiddeti arasındaki ilişkinin bilgisayarlı tomografi pulmoner anjiyografi ile değerlendirilmesi
Giriş: Bildiğimiz kadarıyla literat?rde tedavi ?ncesi ve sonrası nonmasif, submasif ve masif akut pulmoner emboli (APE)?nin sol atriyum (LA) g?r?nt?leme bulguları raporlanmadı. Bu ?alışmanın amacı nonmasif, submasif ve masif APE?nin tedavi ?ncesi ve sonrası bilgisayarlı tomografi pulmoner anjiyografi (BTPA) ile LA boyutlarını değerlendirmek ve gruplar arasında farklılık olup olmadığını araştırmaktır.
Materyal ve Metod: BTPA ile tanı alan, tedavi sonrası takip g?r?nt?lere ve kayıtlı klinik bilgiye sahip 62 erişkin APE hastası (21 nonmasif, 31 submasif ve 10 masif) ?alışmaya dahil edildi. T?m grupların tedavi ?ncesi ve sonrası LA boyutları iki radyolog tarafından birbirinden bağımsız ?l??ld?.
Bulgular: Tedavi ?ncesi t?m grupta LA boyutu en d?ş?k masif APE'de olup bu farklılık istatistiksel olarak submasif (p= 0.001) ve nonmasif (p< 0.001) gruplara g?re anlamlıydı. Ayrıca submasif APE hastaları nonmasif APE hastalarına g?re daha d?ş?k LA boyutuna sahipti (p= 0.006). Masif ve submasif APE'de tedavi sonrası LA boyutları tedavi ?ncesine g?re istatistiksel olarak anlamlı y?ksekti (her iki grup i?in p< 0.001). Fakat nonmasif APE hastalarında tedavi ?ncesi ve sonrası LA boyut farklılığı istatistiksel olarak anlamlı değildi (p= 0.082).
Sonu?: APE'nin şiddeti arttık?a LA boyutu azalmaktadır. Bu y?zden APE sırasında azalmış bir LA boyutu artan APE şiddetini g?sterebilir. Bu ?alışma tedavi sonrası masif ve submasif APE hastalarında tedavi ?ncesine g?re LA boyutunun istatistiksel olarak arttığını raporladı. Bu sonu?lar LA boyutunun APE?li hastalarda tedaviye yanıt olarak kardiyak morfolojideki değişiklikleri yansıtan ek bir parametre olabileceğini d?ş?nd?rmektedir.
Anahtar kelimeler: Bilgisayarlı tomografi pulmoner anjiyografi; sol atriyum boyutu; akut pulmoner emboli
SUMMARY
Assessment of the association between pre-treatment and post-treatment left atrium size and severity of disease in patients with acute pulmonary embolism by using computed tomography pulmonary angiography
Introduction: As far as we know, left atrium (LA) imaging findings of pre-treatment and post-treatment nonmassive, submassive and massive acute pulmonary embolism (APE) have not been reported in literature. The aim of this study is to assess LA sizes of nonmassive, submassive and massive APE before and after treatment with computed tomography pulmonary angiography (CTPA) and to research whether there are differences between groups.
Materials and Methods: Sixty two adult APE patients (21 nonmassive, 31 submassive and 10 massive) who were diagnosed with CTPA and who had post-treatment follow-up images and recorded clinical information were included in the study. Pre-treatment and post-treatment LA sizes of all groups were measured by two radiologists independently.
Results: The lowest pre-treatment LA size was found in massive APE and this difference was found to be statistically significant when compared with submassive (p= 0.001) and nonmassive (p< 0.001) groups. In addition, submassive APE patients were found to have lower LA size when compared with nonmassive APE patients (p= 0.006). In massive and submassive APE, post-treatment LA sizes were found to be statistically significantly higher when compared with pre-treatment (p< 0.001 for both groups). However, in nonmassive APE patients, pre-treatment and post-treatment LA size difference was not found to be statistically significant (p= 0.082).
Conclusion: As the severity of APE increases, LA size decreases. Thus, a decrease LA size during APE can show increased APE severity. This study reported that LA size increased statistically in post-treatment massive and submassive APE patients when compared with pre-treatment. These results suggest that in APE patients, as a response to treatment, LA size can be an additional parameter reflecting the changes in cardiac morphology.
Key words: Computed tomography pulmonary angiography; left atrium size; acute pulmonary embolism
Geliş Tarihi/Received: 12.09.2018 - Kabul Ediliş Tarihi/Accepted: 12.01.2019
INTRODUCTION
Acute pulmonary embolism (APE) is a common disease that can cause mortality and morbidity (1). Computed tomography pulmonary angiography (CTPA) is the currently preferred method for the diagnosis of APE (2,3). Right ventricle dysfunction (RVD) occurs as a direct result of acute obstruction of the main branches of pulmonary artery (4). Right ventricle (RV) following massive APE has been well-defined in computed tomography (CT). CTPA showed that it can contribute to determining the risk in APE patients by showing the increase in RV/left ventricle (LV) diameter rate which represents the assessment of RVD (5-9).
Insufficient filling of left atrium (LA) in APE can result from mechanisms which include decreased preload, decreased afterload and precardial tension. Decreased LA volume resulting from low filling can accompany significant obstruction of pulmonary arteries (10,11). Although CT findings of RVD have been well-defined in APE in literature, few studies related with LA volume have reported that decreased LA volume can be associated with higher mortality (11,12).
Aviram et al. showed that a higher pulmonary artery thrombus load in APE is associated with a smaller LA area and greater RA area (13). Ocak et al. defined massive pulmonary pre-embolism and post-embolism LA volume imaging findings with three patients for the first time (10). In their study, they reported with CTPA that pre-treatment LA volume increased statistically significantly (p< 0.01). In submassive pulmonary embolism (PE), mortality is between 5-15% and advanced risk assessment should be conducted to find out the group with high mortality risk. In nonmassive APE, when patients? cardiac biomarker positivity or right ventricle dysfunction symptom is found with a mortality rate between 0.7-1.2%, these patients should be included in submassive APE risk group (14,15). As far as we know, LA imaging findings of pre-treatment and post-treatment nonmassive, submassive and massive APE have not been reported in literature.
The aim of this study is to assess LA sizes of nonmassive, submassive and massive APE before and after treatment with CTPA and to research whether there are differences between groups.
MATERIALS and METHODS
Patients
This study was approved by the ethical committee of our university. The hospital?s medical data base was used for this retrospective study. CTPA images of 591 adult patients who referred to our emergency service with a suspicion of APE between May 2014-June 2016 were examined retrospectively. APE was diagnosed in 286 patients with CTPA. One hundred and fifty-nine patients were excluded from the study since they did not have post-treatment follow-up images. Fourteen patients were excluded from the study due to insufficient images of the heart. Fifty one patients who did not have clinical information which included predisposing factor, transthoracic echocardiography findings, ejection fraction, heart pressure and heart rate were excluded from the study. As a conclusion, 62 patients [30 males, 32 females; average age (? SD), 65.2 ? 14.3 years; age range, 21-88 years] were included in the study. The patients were grouped as massive, submassive and nonmassive pulmonary embolism according to their clinical and echocardiography findings. If the patients who were found to have systemic low blood pressure on admission to hospital or syncope history also had RV dysfunction symptoms in echocardiography, they were grouped as massive pulmonary embolism. The patients who had normal systemic blood pressure and RV dysfunctions in the echocardiography but no syncope history were grouped as submassive pulmonary embolism. Patients who had normal systemic blood pressure and RV functions were grouped as nonmassive pulmonary embolism. Twenty one patients were diagnosed with nonmassive APE [9 males, 12 females; average age (? SD), 64.1 ? 13.7 years], 31 patients were diagnosed with submassive APE [16 males, 15 females; average age (? SD), 65.9 ? 14.6 years] and 10 patients were diagnosed with massive APE [5 males, 5 females; average age (? SD), 65.5 ? 13.1 years] APE.
Computer Tomography Technique
16-detector multi-section computer tomography (CT) (Aquilion TSX-101A; Toshiba Medical Systems Corporation, Tokyo, Japan) was applied on all APE patients. Scanning parameters were made with 250 mAs, 120 kV, pitch 1, 16 x 1 mm collimation, 1 mm reconstruction range and 1 mm section thickness. With the topogram image taken when the patients were in supine position, the area from aortic arc level to the diaphragm was determined as examination area. These patients were given 120 mL nonionic iodine contrast matter (Ultravist 370; Bayer Schering Pharma, Berlin, Germany) with automatic injector (Ulrich Medizintechnik, Ulm, Germany) 4 mL in a second through catheter from antecubital vein when the patients were in supine position. PBTA scanning was done 20 seconds after injection started.
Computer Tomography Assessment
CT images of all patients were transferred to Vitrea 2 (Vital Images, Inc. Minnetonka, MN, USA) work station. Two radiologists (K.A. and A.V.P., with 8-15 years of experience, respectively) measured the LA sizes of patients with massive, submassive and nonmassive pulmonary embolism independently and randomly in the workstation. The measurements were obtained from axial images. For all measurements, axial image in which atrium was visually maximum was chosen. Thus, the measurement of LA size was made with ROI drawn with free hand by two radiologists over the axial image in which atrium was maximum. Pulmonary veins were excluded from LA area measurement. Two radiologists were blind to the clinical presentation of the patients and the results of other imaging techniques.
Statistical Analysis
Statistical Package for the Social Sciences (IBM SPSS Statistics version 21; IBM, Armonk, NY, USA) program was used for statistical analysis. Categorical variables were expressed as frequency and continuous variables were given as average ? standard deviation (SD) and proper range. Kolmogorov-Smirnov test was used to assess the normal distribution of numerical data. Kruskal wallis test and One-way Anova test were used to compare pre-treatment intergroup (nonmassive, submassive and massive) and post-treatment LA sizes of APE and Wilcoxon signed-rank test was used to compare pre-treatment and post-treatment intragroup LA sizes of APE. Inter-rater agreement was assessed by using intraclass correlation coefficient (ICC). It was thought that an ICC higher than 0.80 represented a excellent agreement. Statistical significance threshold was determined as p< 0.05.
RESULTS
Table 1 shows demographical and clinical characteristics of nonmassive, submassive and massive APE.
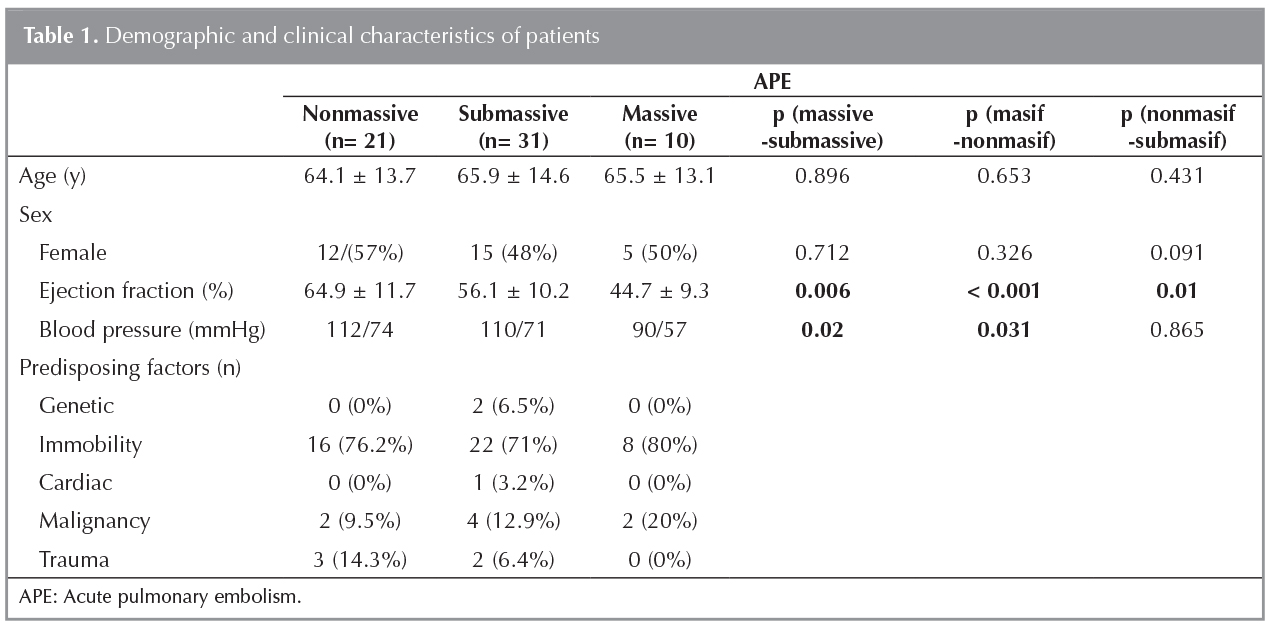
Table 2 summarizes average ? SD values of pre-treatment and post-treatment LA sizes for nonmassive, submassive and massive APE and the average values of difference in size and also statistical analysis related with LA size. The lowest pre-treatment LA size was found in massive APE and this difference was found to be statistically significant when compared with submassive (p= 0.001) and nonmassive (p< 0.001) groups (Figure 1). In addition, submassive pulmonary embolism (PE) patients had lower LA size when compared with nonmassive PE patients and this difference was statistically significant (p= 0.006) (Figure 2,3). No statistically significant difference was found between post-treatment LA sizes of all APE groups (massive-submassive, p= 0.096; massive-nonmassive, p= 0.284; nonmassive-submassive, p= 0.163).
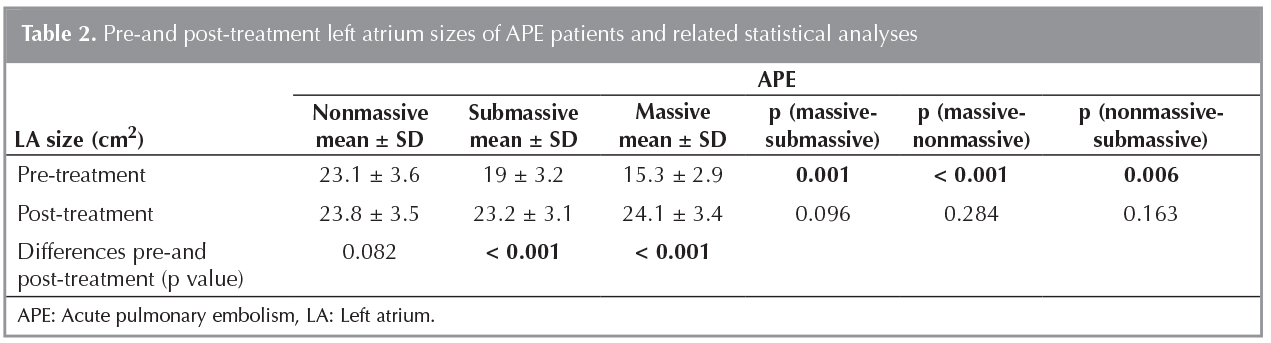
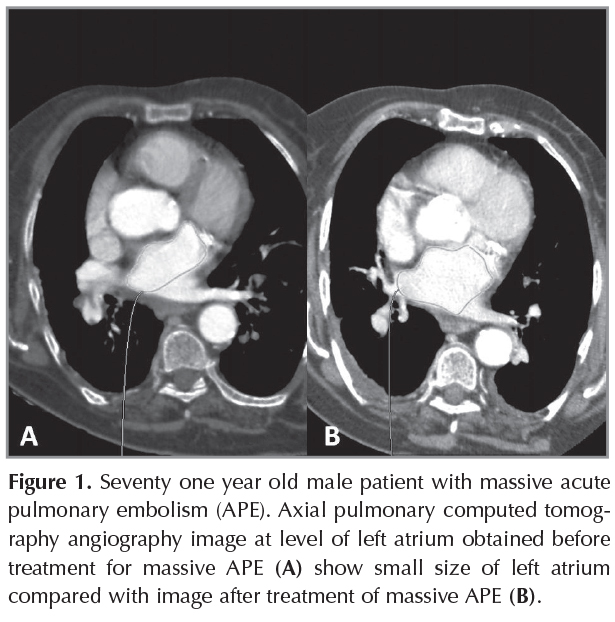
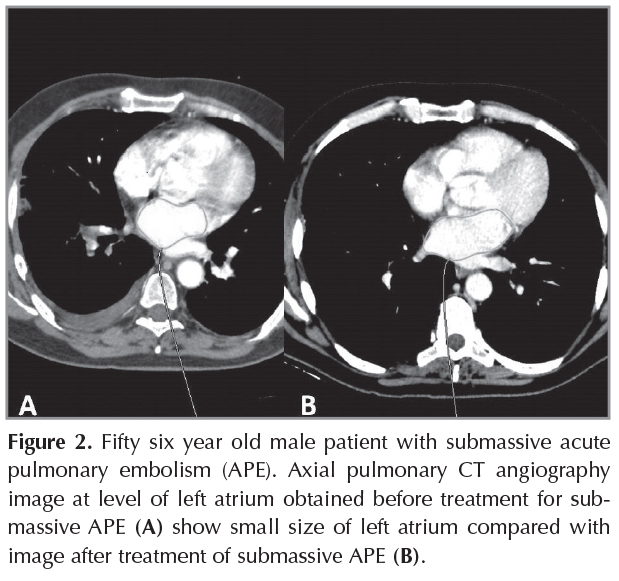
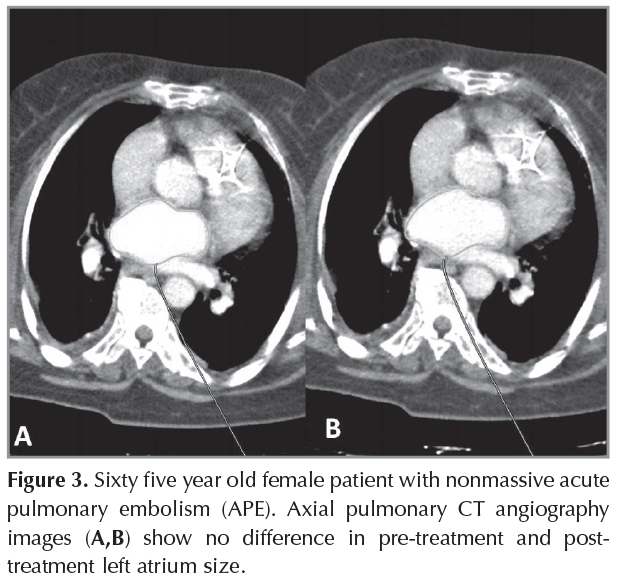
In massive and submassive APE, post-treatment LA sizes were statistically higher than pre-treatment (p< 0.001 for both groups) (Figure 1,2). However, pre-treatment and post-treatment LA size difference was not statistically significant in nonmassive APE patients (p= 0.082) (Figure 3).
Agreement for post-treatment nonmassive, submassive and massive APE LA size measurements was excellent between the two radiologists (ICC= 0.895, 0.941 and 0.926, respectively).
DISCUSSION
The primary finding of our study is that as APE severity increases (nonmassive < submassive < massive), LA size decreases inversely proportionally (massive < submassive < nonmassive). Since it is fast and easy to assess LA with CTPA, it can be used in determining patients with severe APE who can be under risk. In addition, post-treatment LA sizes of APE groups were reported for the first time in literature and it was shown that LA size increased significantly in massive and submassive APE patients when compared with pre-treatment (p< 0.001 for both groups); however, no statistical difference was found in nonmassive group (p= 0.082). Our study suggest that LA size can be an additional parameter that can be assessed as response to therapy in patients with APE.
While mortality rate is between 0.7-1.2% in nonmassive APE, it differs between 5-15% in submassive APE. Advanced risk assessment should be made to find out the group with bad prognosis, high mortality risk and in need of thrombolytic treatment among submassive APE cases. In addition, when cardiac biomarker positivity or right ventricle dysfunction finding is found in nonmassive APE patients, these patients should be added in submassive APE risk group (14,15). Most of the computed tomography pulmonary angiography (CTPA) studies reported that RVD should be assessed in relation to APE (5-9,16,17). However, few studies in literature about LA volume reported that decreased LA volume can be associated with higher mortality (11,12). In addition, decreased LA size due to decreased venous return as a result of the high clot load in APE was reported only in case reports (10,18).
Results of pathophysiological studies showed anatomic obstruction caused by embolism, release of vasoconstrictive agents and an increase in pulmonary vascular resistance in APE (19). The sudden increase in pulmonary vascular resistance can cause RV dilatation which is a cause of death in APE and insufficiency in extreme pressure load. The decrease in stroke volume of RV can cause sudden deficit filling of LA and a decrease in pulmonary venous return. This situation can cause decreases in LV frontal load, cardiac out-put, systemic blood pressure and coronary perfusion and consequently circulation failure (20,21). The decrease in LA volume resulting from increased hemodynamic load caused by increased pulmonary vascular resistance accompanying APE can be more obvious than the changes in ventricular level. This situation was defined with three patients by Ocak et al. for the first time in literature (10). This study reported that with CTPA post-treatment LA volume increased statistically significantly in massive APE (p< 0.01). Similarly, it was shown in our study that post-treatment LA size increased statistically in massive and submassive APE patients when compared with pre-treatment (p< 0.001, for both groups), while there was no statistical difference in the nonmassive group (p= 0.082).
Aviram et al. showed that a higher pulmonary artery clot load was associated with a smaller LA area and a larger RA area in evaluating the relationship between the embolic obstruction grade and the LA and RA areas in APE (13). In their study they reported that LA sizes in CTPA could be used an early parameter reflecting changes in cardiac morphology due to pulmonary artery obstruction and that they could contribute to a more comprehensive risk assessment in APE patients. As far as we know, this is the first study showing an association between APE severity (nonmassive, submassive and massive) and LA size. In our study, we reported that pre-treatment LA sizes were the greatest for nonmassive APE patient group and as APE severity increased, LA sizes decreased (smallest LA sizes in massive group). Pre-treatment LA sizes of patients with massive APE were statistically significantly lower when compared with submassive (p= 0.001) and nonmassive (p< 0.001) groups. In addition, LA size difference between submassive and nonmassive groups was statistically significant (p= 0.006). Increased APE severity can result in a decrease in pulmonary venous return to LA. RV dysfunction does not only cause a deterioration in LV diastolic filling, it also causes an enlargement of RA due to increase in RV-RA filling pressures and this in turn causes compression and decrease in neighboring LA sizes (22).
Our study had some limitations. The first of these was using nongated CTPA to assess LA size. Since images represent the averages of systole and diastole in this method, myocardial boundaries will become somewhat blurred. The volumes calculated this way cannot be associated with any special phase of cardiac cycle. The aim of this study is to examine the data obtained in the routine clinic in which nongated CT scans are made. Second limitation was using field measurements rather than volumetric measurements. Aviram et al. reported that CTPA can be a fast tool which can differentiate between cardiac responses in central or peripheral PE with automatic volumetric analysis (23). To confirm the results of our study, studies should be conducted which measure LA with automatic volumetric analysis software programs. Third limitation was the relatively small number of APE groups. Lastly, since our study was retrospective and since we did not know whether the reason of death within 30 days was associated with APE in APE patient groups (nonmassive, submassive and massive), we could not obtain sufficient data bout the association between our results and patients? results. Prospective studies are needed to compare large APE groups and LA sizes and to research whether it should guide intergroup risk assessment and treatment decisions.
Conclusion
Our study was based on LA size measurement obtained from routine nongated CTPA in APE group (nonmassive, submassive and massive). The results of our study showed that a higher pre-treatment APE severity was associated with a smaller LA area. For this reason, the presence of a decreased LA size during APE can be used in assessing APE severity. In addition, this study reported that post-treatment LA size increased statistically in massive and submassive APE patients (p< 0.001 for both groups) when compared with pre-treatment, while no statistical difference was found in nonmassive group (p= 0.082). Our study shows that LA size can be an additional parameter reflecting cardiac morphology changes as a response to treatment in APE patients.
CONFLICT of INTEREST
The authors reported no conflict of interest related to this article
AUTHORSHIP CONTRIBUTIONS
Concept/Design: KA, AVP
Analysis/Interpretation: All of authors.
Data Acquisition: KA, AVP, AG
Writting: KA
Critical Revision: KA, AVP
Final Approval: All of authors.
REFERENCES
- Meyer G, Vicaut E, Danays T, Agnelli G, Becattini C, Beyer-Westendorf J, et al. Fibrinolysis for patients with intermediate-risk pulmonary embolism. N Engl J Med 2014;370:1402-11.
- Konstantinides SV, Torbicki A, Agnelli G, Danchin N, Fitzmaurice D, Gali? N, et al. Task Force for the Diagnosis and Management of Acute Pulmonary Embolism of the European Society of Cardiology (ESC). 2014 ESC guidelines on the diagnosis and management of acute pulmonary embolism. Eur Heart J 2014;35:3033-69.
- Remy-Jardin M, Pistolesi M, Goodman LR, Gefter WB, Gottschalk A, Mayo JR, et al. Management of suspected acute pulmonary embolism in the era of CT angiography: a statement from the Fleischner Society. Radiology 2007;245:315-29.
- Santos Mart?nez LE, Uriona Villarroel JE, Exaire Rodr?guez JE, Mendoza D, Mart?nez Guerra ML, Pulido T, et al. Massive pulmonary embolism, thrombus in transit, and right ventricular dysfunction. Arch Cardiol Mex 2007;77:44-53.
- van der Meer RW, Pattynama PM, van Strijen MJ, van den Berg-Huijsmans AA, Hartmann IJ, Putter H, et al. Right ventricular dysfunction and pulmonary obstruction index at helical CT: prediction of clinical outcome during 3-month follow-up in patients with acute pulmonary embolism. Radiology 2005;235:798-803.
- Schoepf UJ, Kucher N, Kipfmueller F, Quiroz R, Costello P, Goldhaber SZ. Right ventricular enlargement on chest computed tomography: a predictor of early death in acute pulmonary embolism. Circulation 2004;110:3276-80.
- Nural MS, Elmali M, Findik S, Yapici O, Uzun O, Sunter AT, et al. Computed tomographic pulmonary angiography in the assessment of severity of acute pulmonary embolism and right ventricular dysfunction. Acta Radiol 2009;50:629-37.
- Becattini C, Agnelli G, Germini F, Vedovati MC. Computed tomography to assess risk of death in acute pulmonary embolism: a meta-analysis. Eur Respir J 2014;43:1678-94.
- Oz II, Altınsoy B, Serifoglu I, Sayın R, Buyukuysal MC, Erboy F, et al. Evaluation of right atrium-to-right ventricle diameter ratio on computed tomography pulmonary angiography: prediction of adverse outcome and 30-day mortality. Eur J Radiol 2015;84:2526-32.
- Ocak I, Fuhrman C. CT Angiography Findings of the Left Atrium and Right Ventricle in Patients with Massive Pulmonary Embolism. AJR 2008;191:1072-6.
- Aviram G, Soikher E, Bendet A, Shmueli H, Ziv-Baran T, Amitai Y, et al. Prediction of mortality in pulmonary embolism based on left atrial volume measured on CT Pulmonary Angiography. Chest 2016;149:667-75.
- Chow V, Ng AC, Chung T, Thomas L, Kritharides L. Right atrial to left atrial area ratio on early echocardiography predicts long-term survival after acute pulmonary embolism. Cardiovasc Ultrasound 2013;11:17.
- Aviram G, Steinvil A, Berliner S, Rosen G, Sosna J, Man A, et al. The association between the embolic load and atrial size in acute pulmonary embolism. J Thromb Haemost 2011;9:293-9.
- Torbicki A, Perrier A, Konstantinides S, Agnelli G, Gali? N, Pruszczyk P, et al. ESC Committee for Practice Guidelines (CPG). Guidelines on the diagnosis and management of acute pulmonary embolism: The Task Force for the Diagnosis and Management of Acute Pulmonary Embolism of the European Society of Cardiology (ESC). Eur Heart J 2008;29:2276-315.
- Aujesky D, Obrosky DS, Stone RA, Auble TE, Perrier A, Cornuz J, et al. Derivation and validation of a prognostic model for pulmonary embolism. Am J Respir Crit Care Med 2005;172:1041-6.
- Collomb D, Paramelle PJ, Calaque O, Bosson JL, Vanzetto G, Barnoud D, et al. Severity assessment of acute pulmonary embolism: evaluation using helical CT. Eur Radiol 2003;13:1508-14.
- Ghaye B, Ghuysen A, Willems V, Lambermont B, Gerard P, D?Orio V, et al. Severe pulmonary embolism: pulmonary artery clot load scores and cardiovascular parameters as predictors of mortality. Radiology 2006;239:884-91.
- Hama Y, Yakushiji T, Iwasaki Y, Kaji T, Isomura N, Kusano S. Small left atrium: an adjunctive sign of hemodynamically compromised massive pulmonary embolism. Yonsei Med J 2005;46:733-6.
- Elliott CG. Pulmonary physiology during pulmonary embolism. Chest 1992;101:163-71.
- Lualdi JC, Goldhaber SZ. Right ventricular dysfunction after acute pulmonary embolism: pathophysiologic factors, detection, and therapeutic implications. Am Heart J 1995;130:1276-82.
- Wood KE. Major pulmonary embolism: review of a pathophysiologic approach to the golden hour of hemodynamically significant pulmonary embolism. Chest 2002;121:877-905.
- Chung T, Emmett L, Khoury V, Lau GT, Elsik M, Foo F, et al. Atrial and ventricular echocardiographic correlates of the extent of pulmonary embolism in the elderly. J Am Soc Echocardiogr 2006;19:347-53.
- Aviram G, Soikher E, Bendet A, Ziv-Baran T, Berliner S, Shmueli H, et al. Automatic assessment of cardiac load due to acute pulmonary embolism: Saddle vs. central and peripheral emboli distribution. Heart Lung 2016;45:261-9.
Yazışma Adresi (Address for Correspondence)
Dr. Kerim ASLAN
Ondokuz Mayıs ?niversitesi Tıp Fak?ltesi,
Radyoloji Anabilim Dalı,
Samsun - T?rkiye
E-mail: mdkerim@hotmail.com